Web Console
Monitoring and debugging UI for DeepStructure apps
The Web Console is your best friend in understanding and debugging the live behavior of your deployed apps. There is a Web Console view per deployed application. The Web Console updates in real-time as new events arrive.
The Web Console currently consists of three main views.
📈 Dashboard view
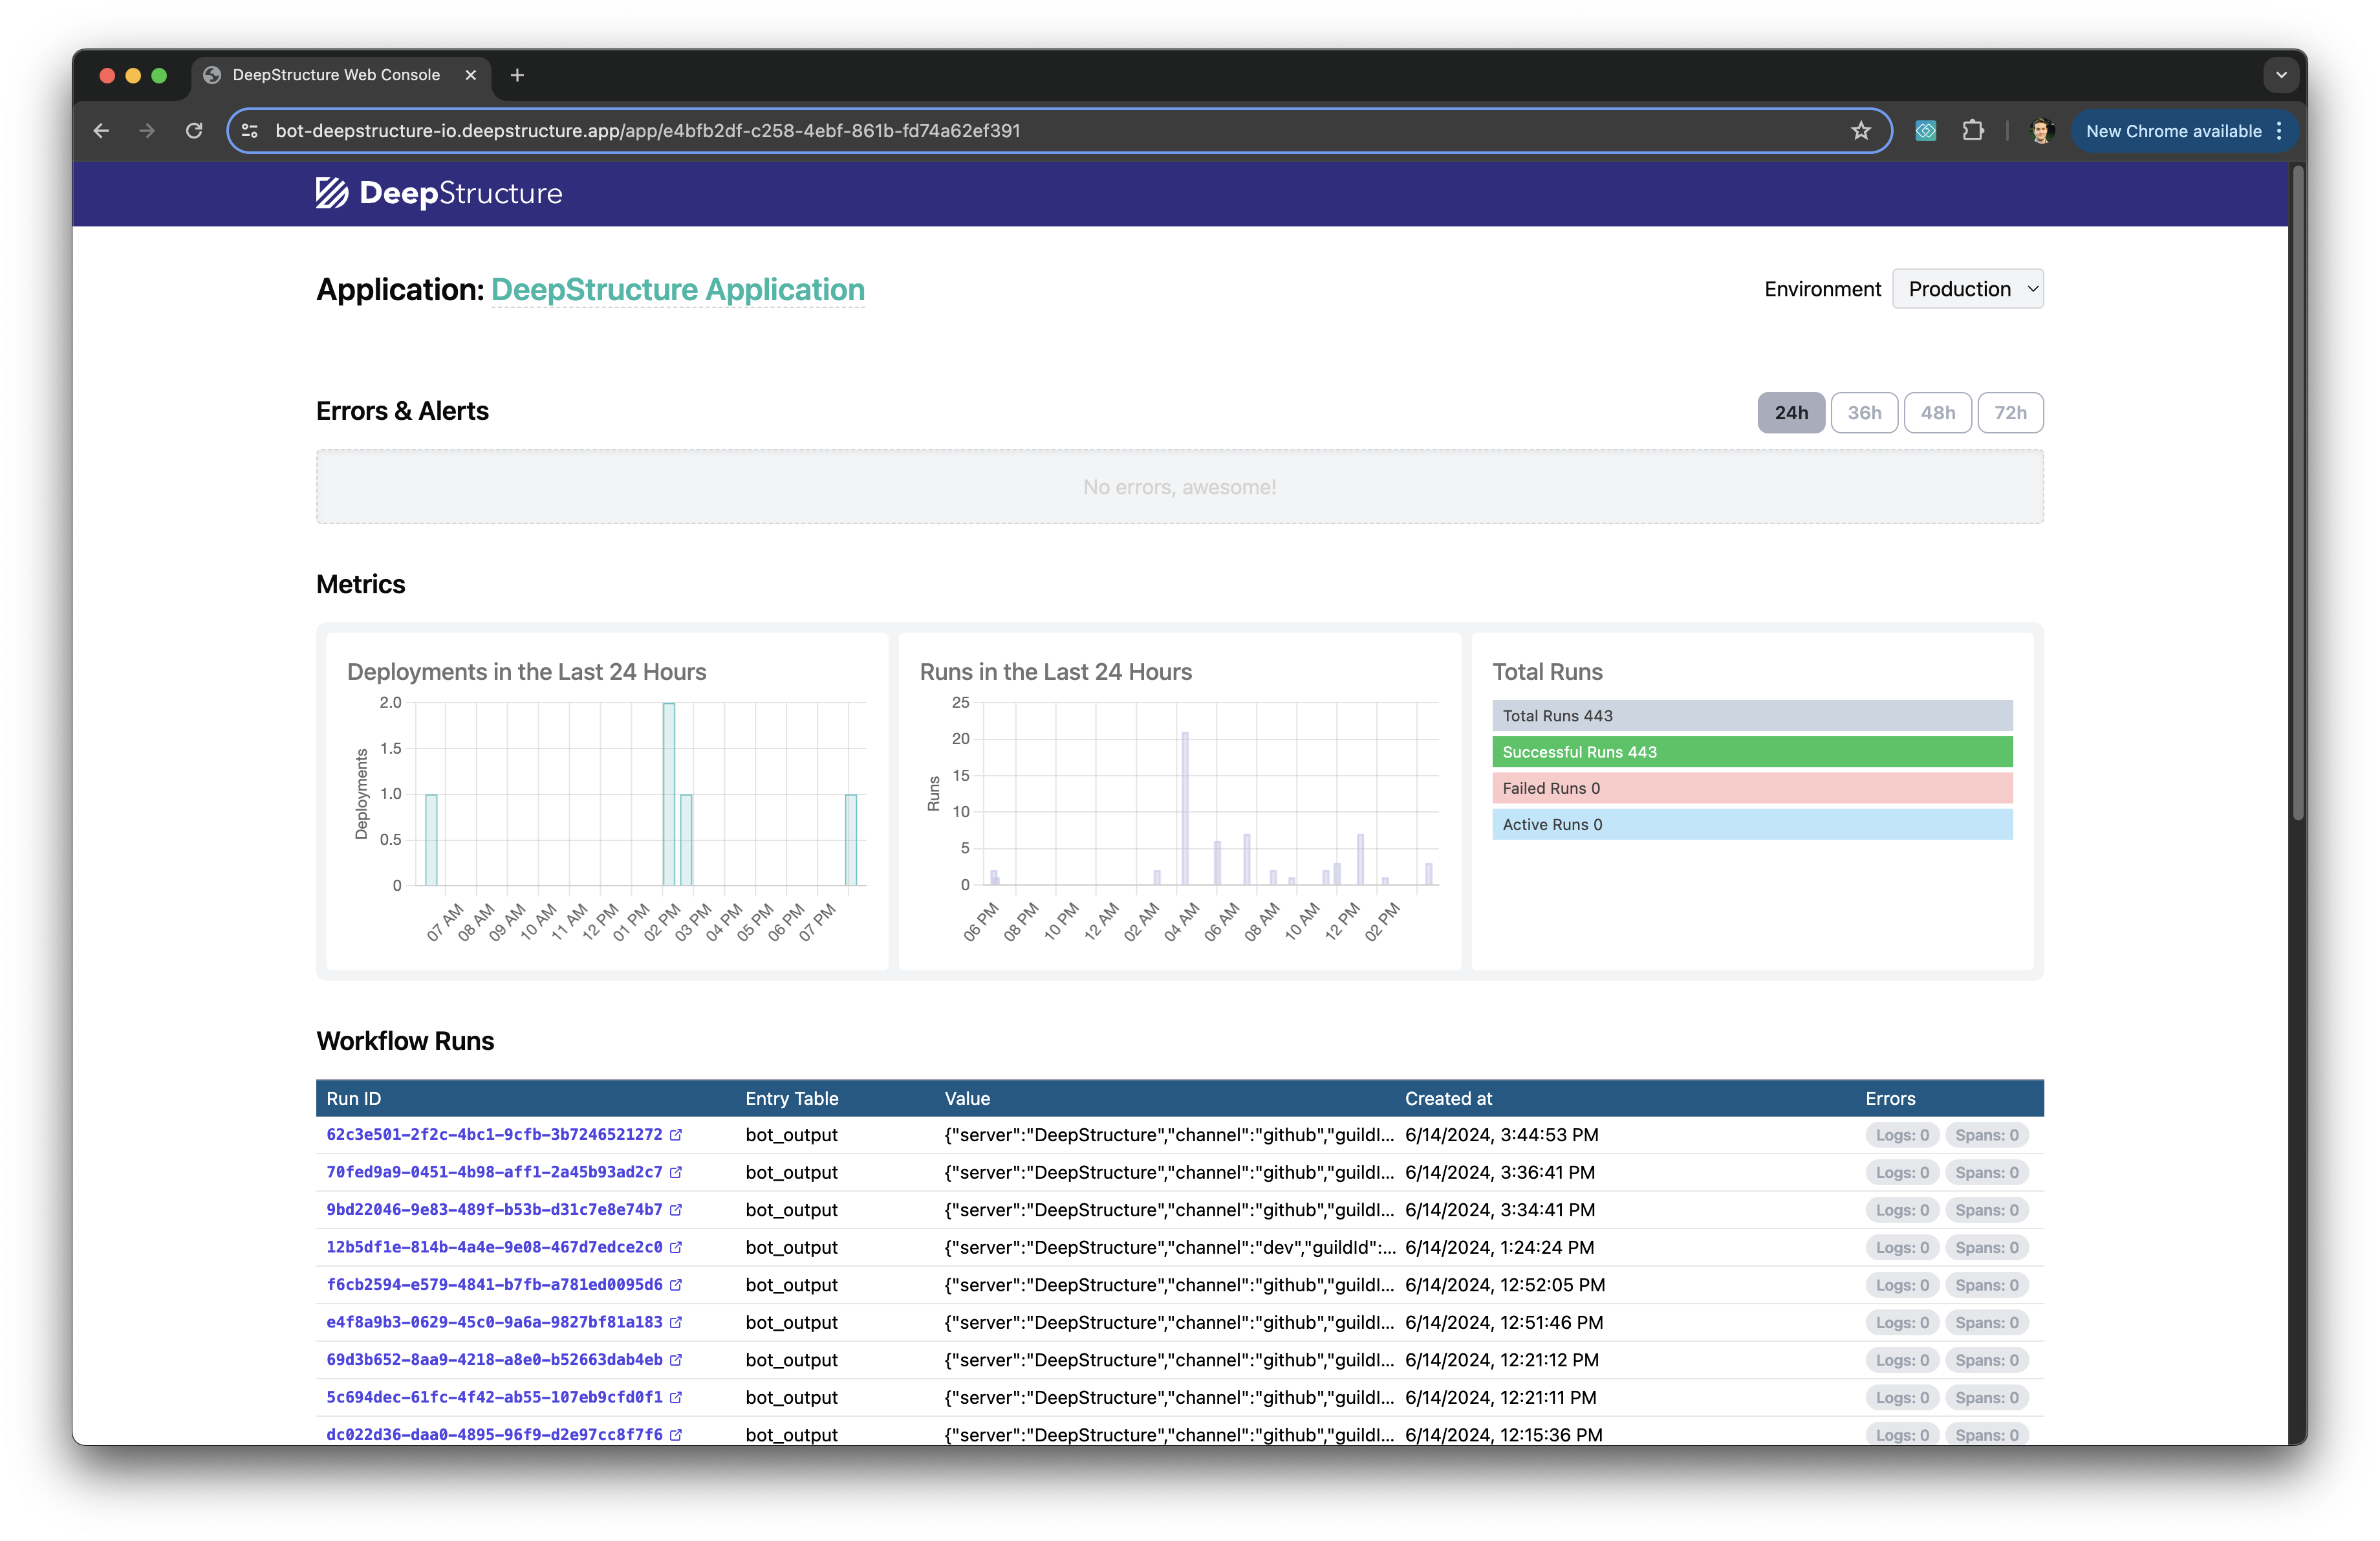
Above the fold, you will find the following panels:
- Errors & Alerts: a prioritized list of error messages and failures that may need urgent attention. Individual events link to the Workflow Run that cause the error or alert; see Workflow Runs below.
- Metrics: summary statistics for the period of time in the top-right. Observe whether there are anomalous behaviors in your app.
- Workflow Runs table: each time a workflow run is triggered, a new row appears in Workflow Runs table. Click on any row's Run ID to pull up the Workflow Run view; see below.

Below the fold, you will find these additional panels:
- Swagger widget: for all HTTP endpoints exposed by your app, send an HTTP request to the endpoints directly for experimentation and debugging. The Swagger widget is generated automatically for your deployed app.
- SQL Console (🏗️ under construction): run raw SQL queries against all the workflow runs and dataflows throughout your deployed app.
🛻 Workflow Run view
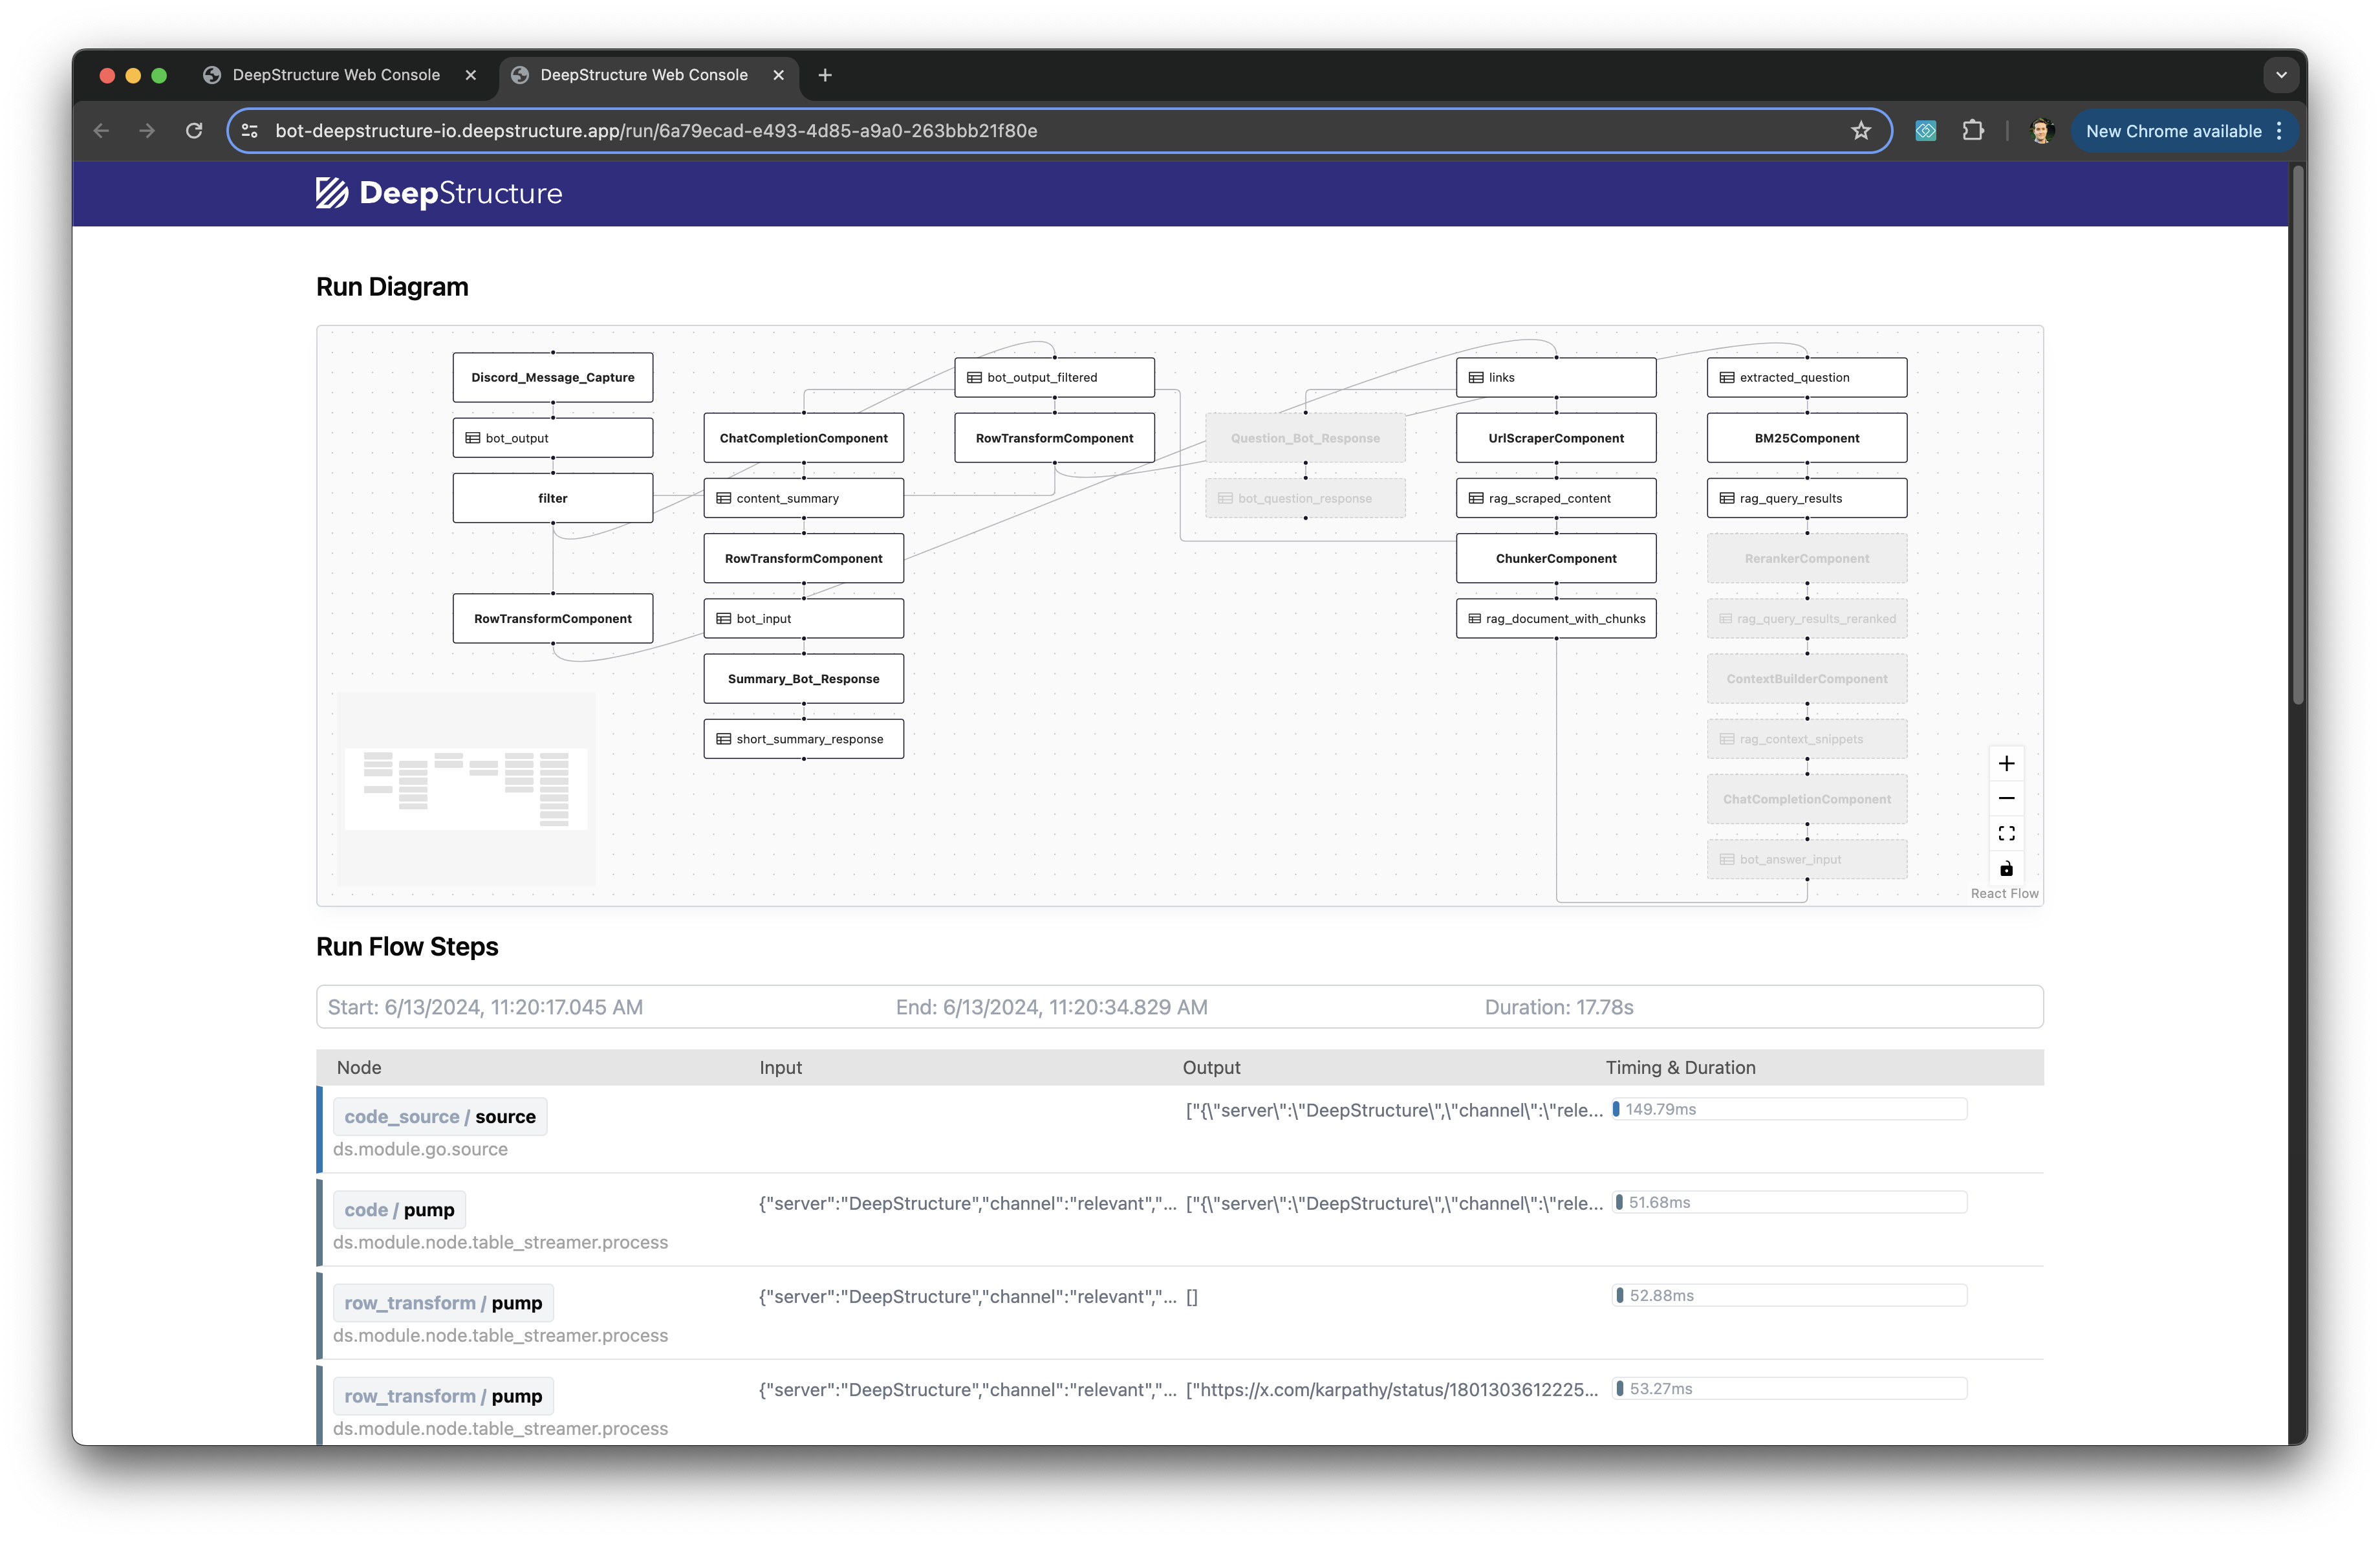
For each run of all your application's workflows, the Workflow Run view shows all the dataflows for that particular workflow row.
The Workflow Run view is the place to answer the question: why did my workflow run produce this unexpected result or error?

The Run Diagram panel shows an interactive chart of the workflow's components, and the data dependencies between them. You can click on any component that participated in the run's dataflows to open the Component Data Flow view for that particular input and output; see below.
And below that, Run Flow Steps panel textually lists all the inputs and outputs through the run's components. Sometimes one panel or the other may be more convenient to read for you, or your debugging task.
Run Flow Steps panel also lists timing information for the components in the run. This is invaluable for debugging performance problems in your application.
🤝 Component Data Flow view
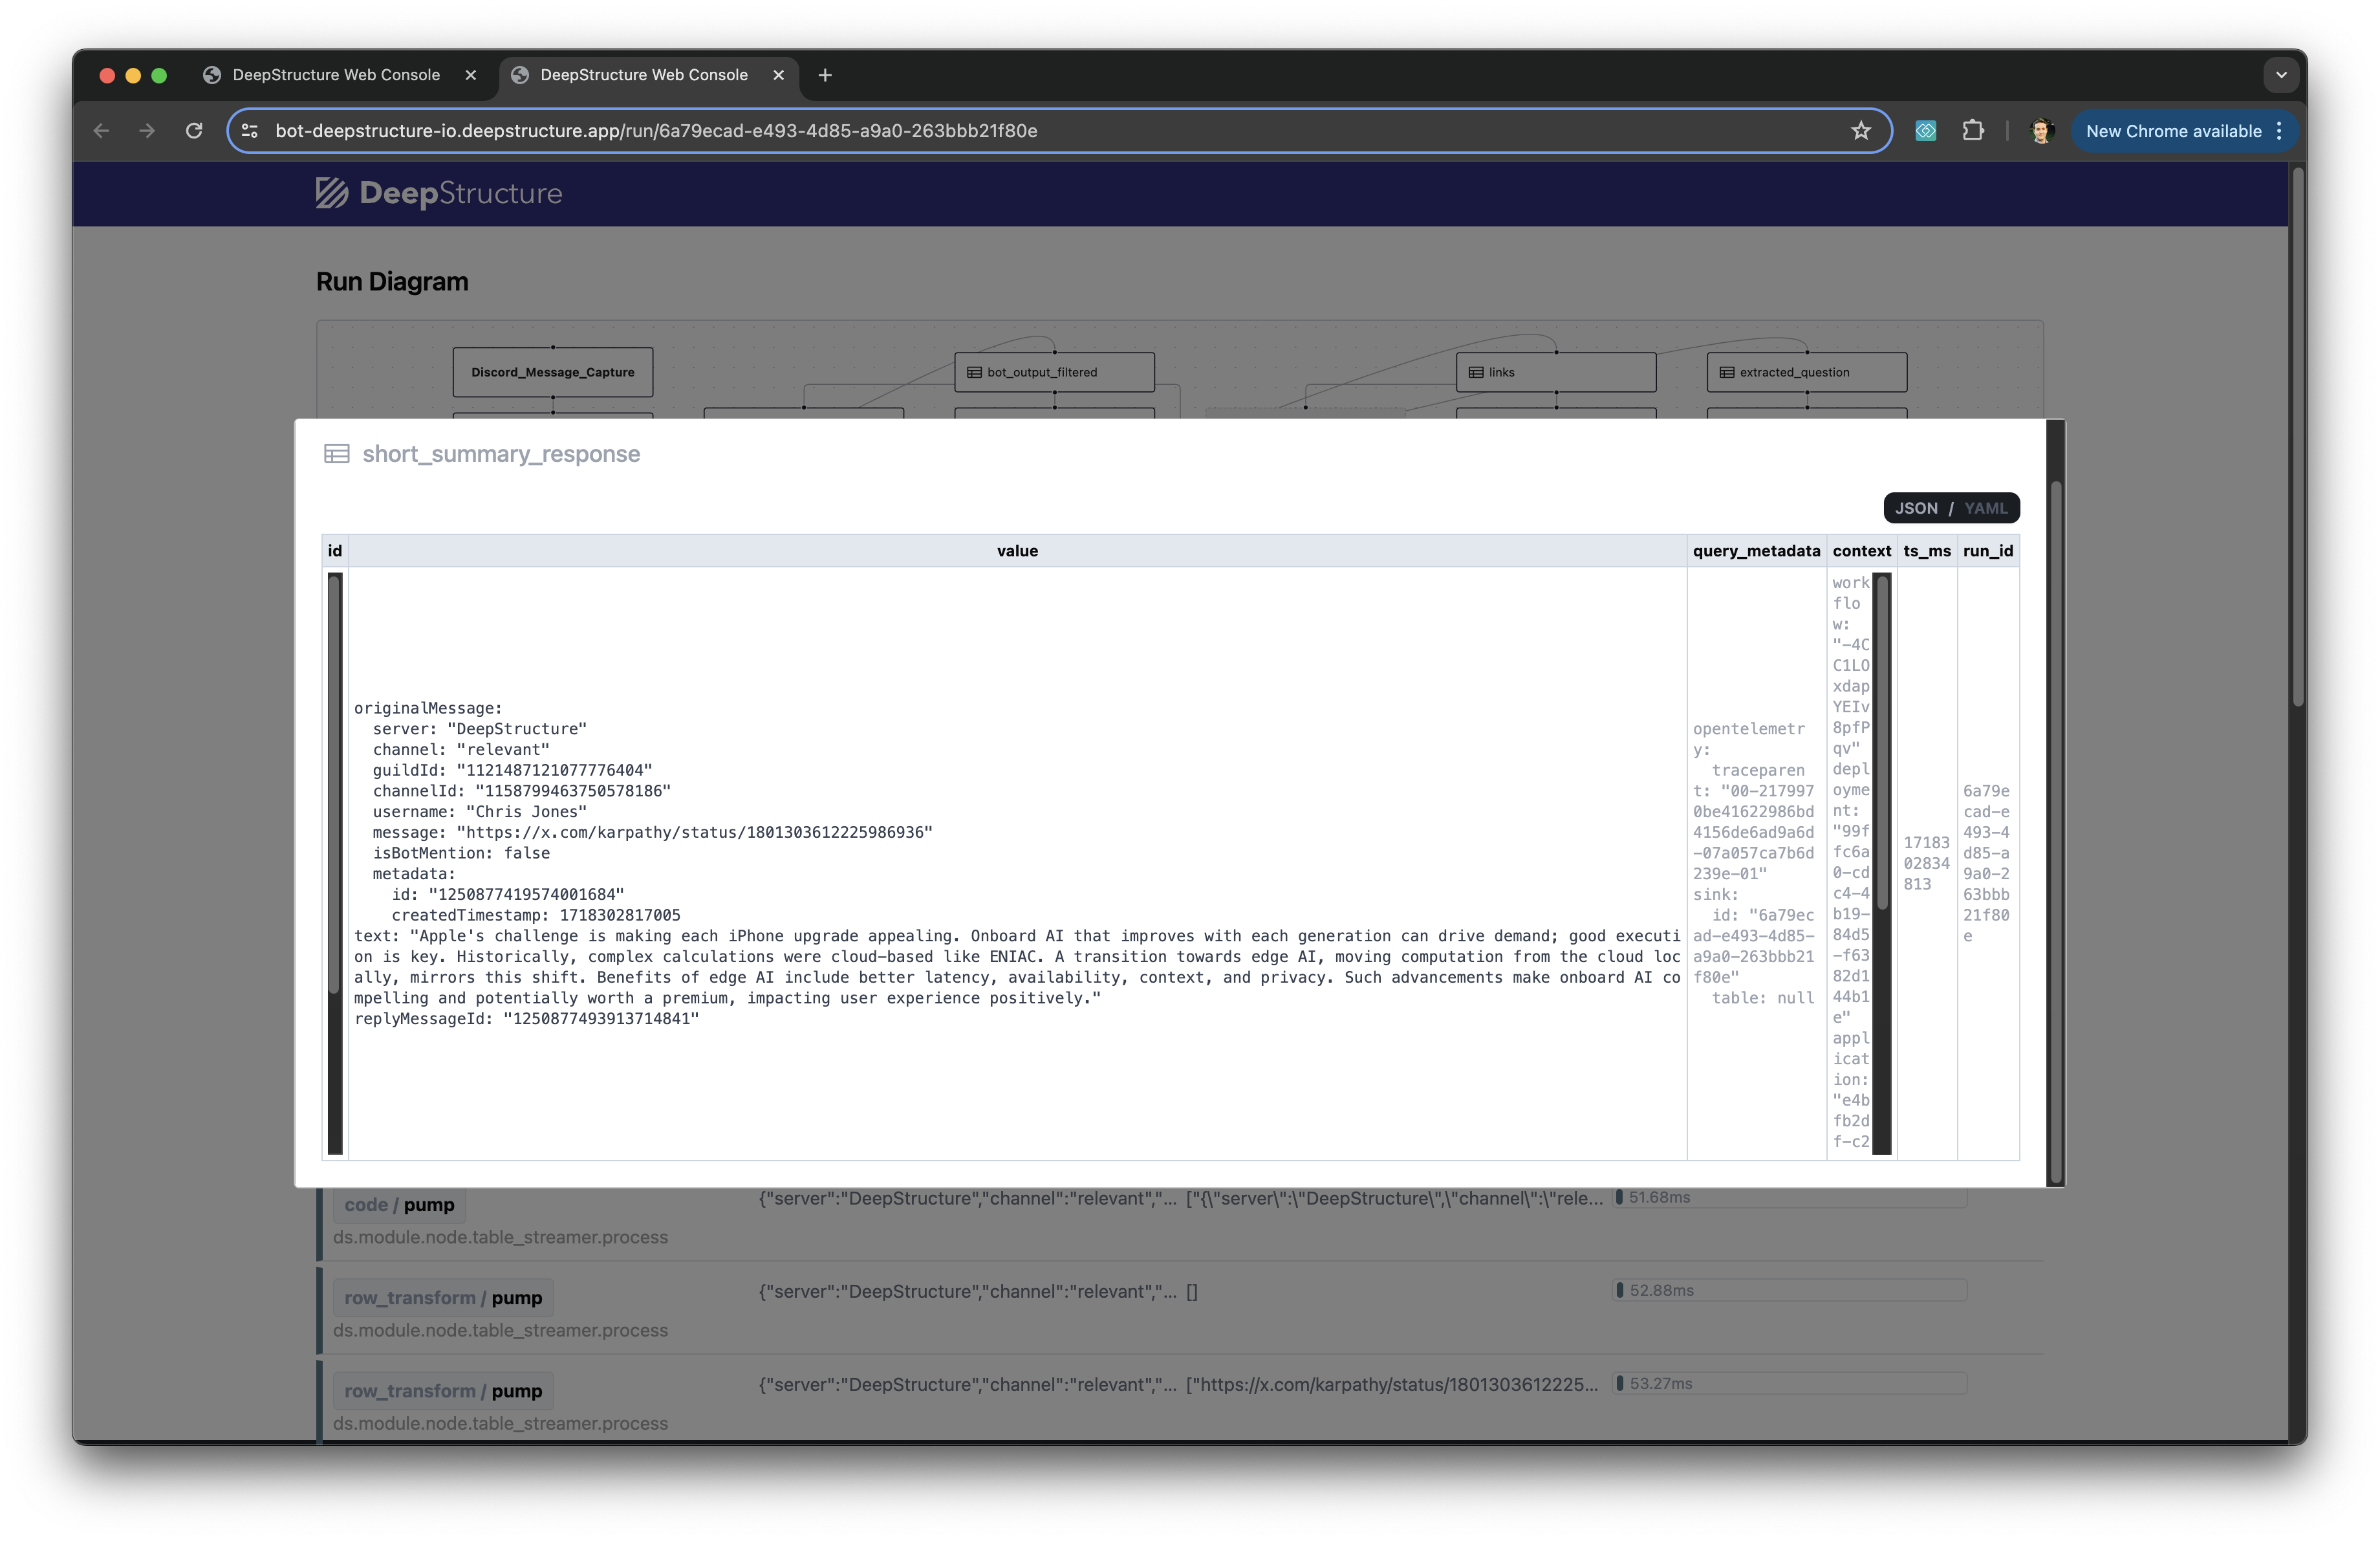
Last but not least, the Component Data Flow view shows detailed information about the inputs and outputs of particular components in particular workflow runs, and associated metadata.
Note in the top-right of the view, you can choose to format data as either raw text, JSON, or YAML.

All of these views and the data they visualize are generated automatically, by virtue of your application running on the DeepStructure Engine.
In other words, comprehensive observability is a byproduct of the way the DeepStructure Engine works: your apps don't need to opt-in to any special tracing or o11y libraries or hooks.
Updated 26 days ago
Dive deeper into the SDK, or learn more about DeepStructure's high-level concepts.
